
Average illuminance can summarize a set of lighting results without showing its lowest value or where that value occurs. To judge industrial lighting uniformity, read the average, minimum and a clearly defined uniformity ratio together. They must refer to the same surface, area, sample points and stated conditions.
The CIE definition of average illuminance refers to a specified surface and requires the illuminance type, such as horizontal or vertical, to be clear. A report that only says “average 500 lux” leaves important interpretation questions open.
This article uses two explicitly fictional point grids to show what an average can conceal. The values are arithmetic teaching examples, not measured lighting, simulated product output or recommended project targets.
Name the uniformity ratio before comparing it
CIE defines illuminance uniformity as minimum illuminance divided by average illuminance on a surface. Using the notation U₀:
U₀ = E_min / E_avg
The numerator and denominator use the same illuminance unit, so U₀ is dimensionless. With a positive average, a value nearer 1 means the minimum is closer to that average. The ratio alone does not say whether the illuminance is sufficient for the task.
Check the report’s formula rather than relying on a heading such as “uniformity.” Lighting Analysts’ AGi32 summary documentation distinguishes average/minimum, minimum/average and other ratios. For example, minimum/average = 0.80 corresponds to average/minimum = 1.25 when both use the same positive values. Those numbers express inverse conventions; they are not conflicting results.
Also distinguish a surface quantity from a sampled result. In the example below, E_avg is the arithmetic mean of nine retained, equally weighted values, and E_min is the smallest of those nine values. Their quotient illustrates the calculation convention. Nine samples do not prove the exact continuous-surface average or the lowest illuminance between the points.
Worked example: equal averages, different sampled minima
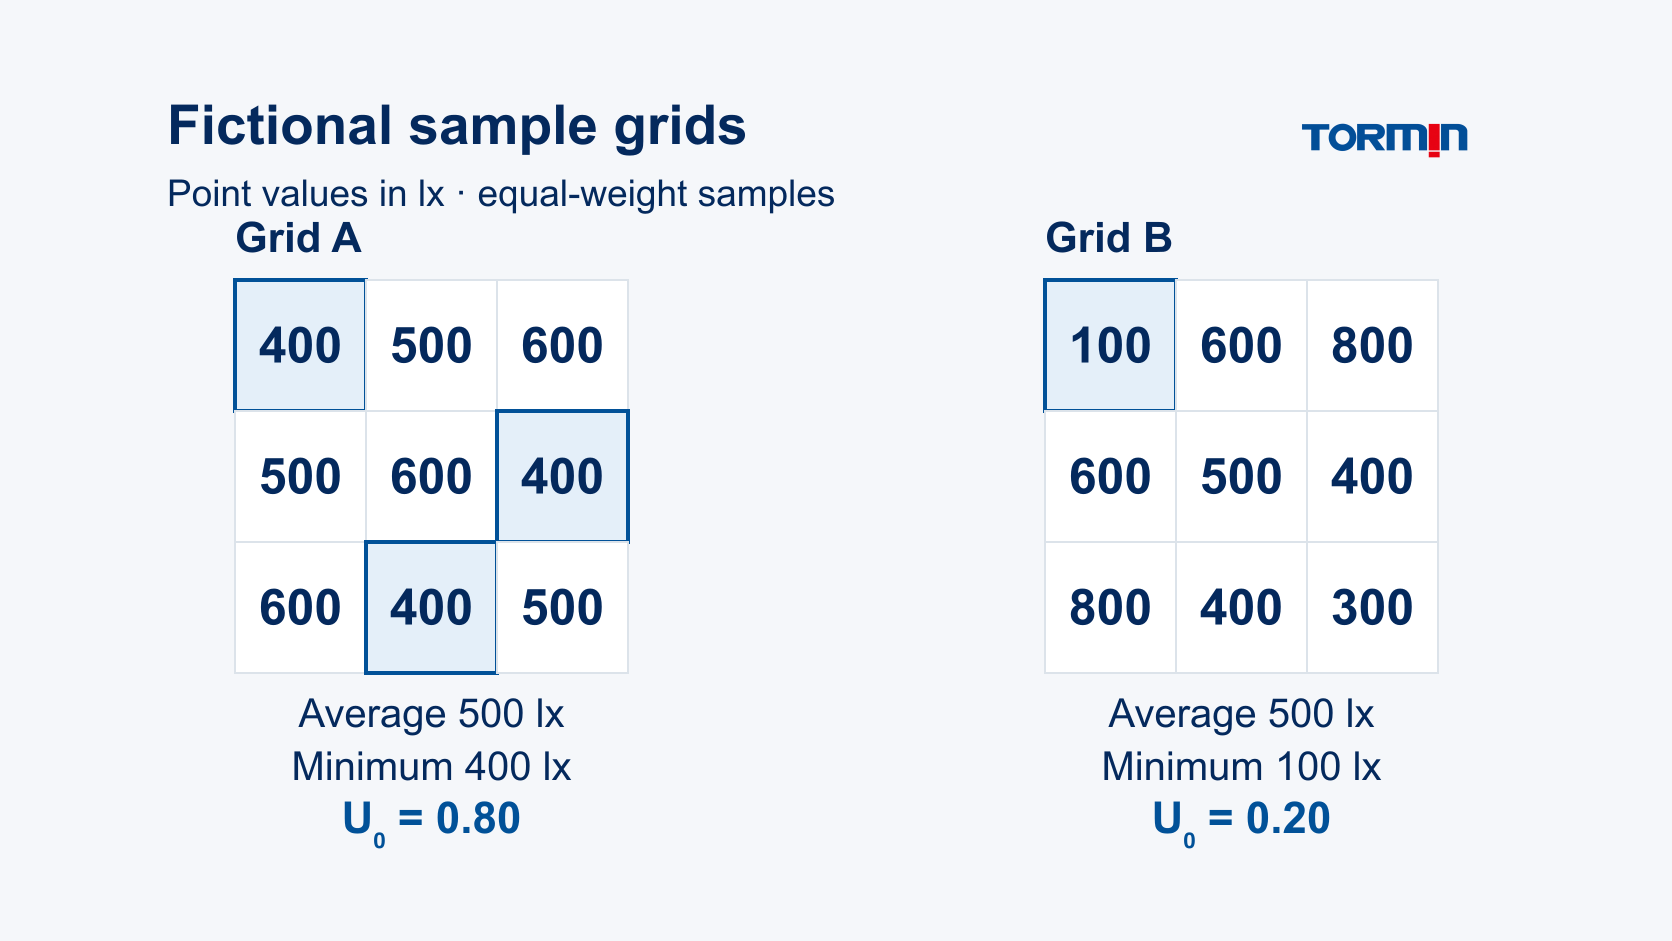
Fictional sample-grid example — invented values for arithmetic only.
Assume two sets of illuminance values at the same nine evenly spaced, equally weighted sample positions on the same hypothetical horizontal plane, within the same declared boundary. R1–R3 identify rows and C1–C3 identify columns. No physical dimensions, mounting height, optical file, operating state or acceptance criterion is implied.
| Sample position | Grid A, lx | Grid B, lx |
|---|---|---|
| R1C1 | 400 | 100 |
| R1C2 | 500 | 600 |
| R1C3 | 600 | 800 |
| R2C1 | 500 | 600 |
| R2C2 | 600 | 500 |
| R2C3 | 400 | 400 |
| R3C1 | 600 | 800 |
| R3C2 | 400 | 400 |
| R3C3 | 500 | 300 |
For each grid, the nine values sum to 4,500 lx. The arithmetic sample-point average is therefore:
E_avg = 4,500 / 9 = 500 lx
| Sample statistic | Grid A | Grid B |
|---|---|---|
| Arithmetic sample-point average | 500 lx | 500 lx |
| Lowest sampled value | 400 lx | 100 lx |
| Sample U₀ = E_min / E_avg | 400 / 500 = 0.80 | 100 / 500 = 0.20 |
The averages match, but Grid B includes a much lower sampled value at R1C1. Grid A’s minimum occurs at three positions: R1C1, R2C3 and R3C2. Looking at the point locations preserves information that the average alone discards.
Neither 500 lx nor either ratio is a pass/fail target. These hand-created arrays establish no real layout, luminaire spacing, product performance or workplace compliance. They demonstrate why the minimum and its location deserve attention alongside the average.
Preserve the plane, boundary and point set
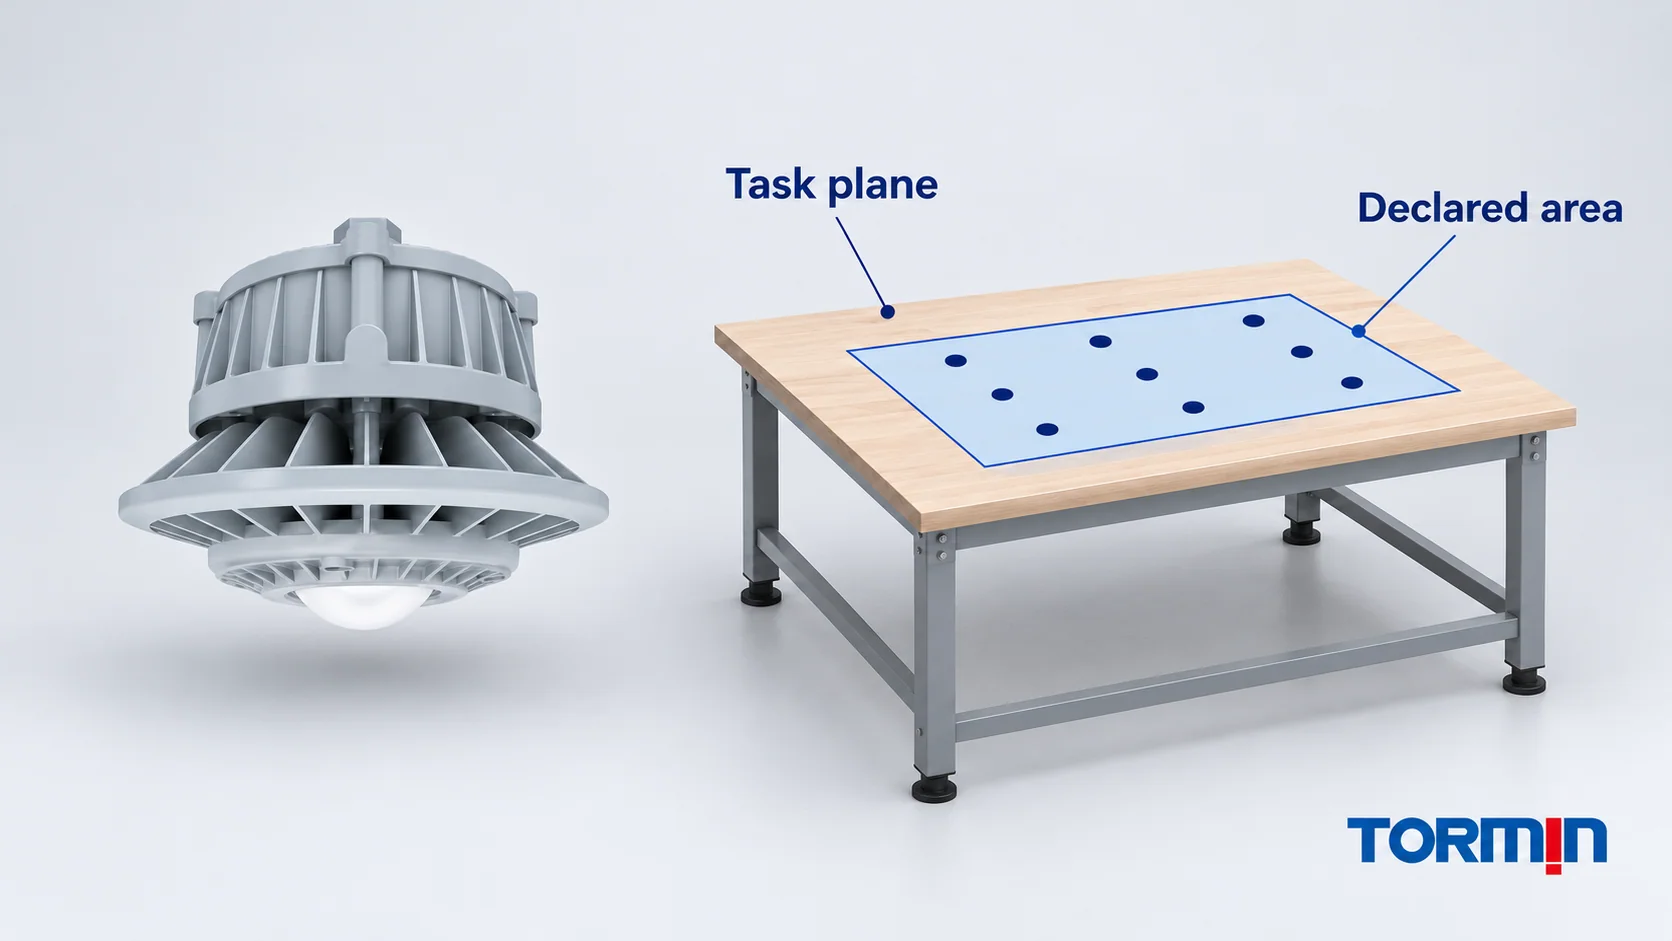
Uniformity statistics are only interpretable when the evaluated region is identifiable. A horizontal packing surface and a vertical rack face are different surfaces. A result for one cannot establish the result for the other simply because both reports use lux.
Keep the calculation-plane description with the numbers: its orientation and location, the area boundary, sample spacing and any excluded positions. AGi32’s calculation-point documentation identifies point spacing, coordinates, grid boundaries, masking and statistical-area options. These are software controls over what is evaluated; they do not prescribe a universal industrial grid.
A comparison should disclose whether these inputs changed. Moving a plane, changing its extent or selecting a different group of points changes the question represented by the summary. The project’s adopted method must determine the relevant sampling arrangement; this article supplies no standard grid spacing or permission to omit an inconvenient result.
The fictional Grid B makes the effect of an exclusion visible. If someone removes its 100 lx point, the remaining values sum to 4,400 lx. Their eight-point average becomes 550 lx, their minimum becomes 300 lx, and the minimum/average ratio becomes approximately 0.545. The underlying nine invented values have not improved. The summary now describes a different retained set.
A justified task-area revision may require a different evaluated set, but it needs a documented reason and a clear comparison basis. Hiding a low point without explaining the exclusion cannot demonstrate improved lighting. Ask to see the point map, not only the summary box.
Decide whether two reports can be compared
Use a report comparison to reach a specific decision, rather than treating a higher-looking number as an automatic improvement.
| What the comparison reveals | Decision and next question |
|---|---|
| Same declared plane, boundary, retained points, ratio convention and calculation basis | Compare average, minimum and the spatial results together; then assess them against the applicable project criteria. |
| Different or missing plane, boundary, point set or ratio formula | Request clarification or an aligned comparison. A changed statistic does not isolate a lighting improvement. |
| Changed geometry, photometric variant, operating mode or maintenance assumptions | Record the changed inputs and obtain the corresponding calculation. Do not attribute the difference to one change unless the comparison supports that conclusion. |
Operating and maintenance bases matter. CIE’s maintained average illuminance definition concerns the specified surface at the time maintenance should be carried out. An initial-output result and a maintained-output result must be identified accurately; matching the report headings does not resolve different stated assumptions.
Keep a short decision record with the reviewed files:
Reports and revisions compared:
Evaluated plane, boundary and retained sample set:
Uniformity formula and illuminance units:
Operating/maintenance basis and changed calculation inputs:
Decision: comparable / clarification needed / revised calculation needed
Applicable acceptance criteria and responsible reviewer:
Comparability and acceptance are separate decisions. A high minimum/average ratio can accompany uniformly low values. A sufficient average can coexist with a low sampled minimum. Neither statistic, by itself, evaluates glare or proves that the whole lighting design is suitable. Use the criteria adopted for the particular project and task, and retain the responsible reviewer’s assessment.
Request the calculation behind the product proposal
When a quotation includes an average-lux or uniformity claim, ask which exact offered configuration, photometric file and calculation revision produced it. Review the geometry, surface assumptions, obstructions, operating mode and maintenance basis with the evaluated plane and point set. The IES photometric-file guide explains the file-identity questions; the lighting-specifications resource provides the broader specification context.
The official TORMIN ZY8607P product page is the first-party exterior reference used for this article’s illustrations. Its photograph supplies no illuminance grid, and none of the fictional values above describes its performance.
For a proposed industrial LED high-bay lighting arrangement, contact TORMIN with the defined task plane, layout and project criteria to request the relevant exact-variant photometric documents and a documented calculation basis. Keep the resulting evidence separate from the arithmetic teaching example.
Sources
- CIE — Average illuminance, e-ILV term 17-29-155, CIE S 017:2020 — specified surface, illuminance type and lux units.
- CIE — Illuminance uniformity, e-ILV term 17-29-160, CIE S 017:2020 — minimum/average definition and dimensionless quantity.
- Lighting Analysts — AGi32 Help: Summary — retained-point arithmetic mean, extrema and named ratio conventions; software-method documentation, not project acceptance criteria.
- Lighting Analysts — AGi32 Help: Calculation Points — Concepts — calculation-point, grid, masking and statistical-area options.
- CIE — Maintained average illuminance, e-ILV term 17-29-157, CIE S 017:2020 — maintained-average terminology for a specified surface.
- TORMIN — ZY8607P product page — first-party product identity and exterior reference only; no exact-variant photometry or performance calculation was assessed for this article.