
To read an IES photometric file, check its identity and version, identify the intensity scale, then match each angle pair to its candela value. Finally, review how the imported distribution is oriented in the lighting model. Opening the file successfully is only the beginning of that review.
An .ies file describes a luminaire’s directional light distribution. It is plain text, readable in a text editor, and an input to lighting calculation software. The modeled space and surface properties remain separate inputs. IES: Learn About IES Files.
For industrial lighting, the practical question is whether the file represents the exact optic and operating configuration being offered—and whether its data are being used with the intended scale and orientation. The walkthrough below teaches that review without supplying a lighting design or a real product’s test results.
1. Match the file to the offered configuration
Keep an unchanged copy of the supplier’s file. Compare its descriptive header with the quotation, datasheet and associated photometric report. Look for the manufacturer, luminaire description, optic, test reference and issue information. A similar filename or the same product family is not enough to resolve a variant mismatch.
Record the supplier’s clarification when the match is unclear. For example, if a quotation names one optic but the file description names another, request the correct file before calculating the layout. Do not rename the file to make the descriptions appear consistent.
Identify the format version before interpreting numeric fields. The current IES catalogue lists ANSI/IES LM-63-19(R25). The example here is explicitly LM-63-2002, a legacy format documented in the software reference below. Do not assume every version has identical field meanings.
2. Locate the description-to-data boundary
The legacy description precedes TILT=.... With NONE, numeric data follow directly; INCLUDE or an external reference needs tilt data. After the header: vertical angles, horizontal angles, then candela groups in horizontal-angle order. Lighting Analysts: LM-63-2002 format layout.
Here is an incomplete teaching fragment with invented values, not a measured luminaire, complete standards-compliant file or file to use in a design:
IESNA:LM-63-2002
... descriptive header omitted ...
TILT=NONE
1 -1 1 5 2 1 2 0.4 1.2 0
1 1 100
0 30 60 80 90
0 90
3000 2400 1200 100 0
3000 1200 300 50 0
Read its first numeric row by position:
| Position | Meaning | Teaching value |
|---|---|---|
| 1–3 | Lamp count; lumens per lamp; candela multiplier | 1; -1; 1 |
| 4–5 | Vertical-angle count; horizontal-angle count | 5; 2 |
| 6–7 | Photometric type; dimensional units | 1; 2 |
| 8–10 | Luminous width, length and height | 0.4; 1.2; 0 |
The second numeric row contains ballast factor, the field labelled future use, and input watts: 1 1 100. The LM-63-02 authorized preview contents identifies those fields as 5.14–5.16. Keep that middle field distinct from a candela multiplier.
Here, type 1 denotes Type C, and units 2 means metres for the luminous dimensions. The intensity values remain distinct from lux. Lighting Analysts: format checks and units.
3. Check absolute photometry, multipliers and dimensions
The -1 lumens-per-lamp entry indicates absolute photometry, not negative light output. The candela multiplier applies to the listed intensity values; our example uses 1. Luminous dimensions describe the light-emitting shape, and input watts is electrical input. TILT=NONE means no lamp-output tilt-correction data are supplied; it does not instruct the designer to leave the installed luminaire unaimed. Lighting Analysts: general photometric fields and tilt information.
For absolute photometry, obtain total luminaire lumens from the software’s flux calculation or the matching report. Do not read -1 as total lumens. For relative data, establish the test-lumen basis and any authorized proration. AGi32’s documentation distinguishes these quantities and recommends manufacturer consultation on the accuracy of proration. Luminaire photometry documentation.
When comparing files, ask the supplier to explain any scaling instead of applying a wattage ratio yourself. A new electrical setting does not establish that the original angular distribution remains valid. Keep the original file’s multiplier and the lighting model’s additional adjustments visible in the review.
4. Read one angle pair from the candela array
The example declares five vertical angles and two horizontal angles. Its ten intensity entries therefore form two groups of five:
| Vertical angle | First group: horizontal 0° | Second group: horizontal 90° |
|---|---|---|
| 0° | 3000 cd | 3000 cd |
| 30° | 2400 cd | 1200 cd |
| 60° | 1200 cd | 300 cd |
| 80° | 100 cd | 50 cd |
| 90° | 0 cd | 0 cd |
To find horizontal 90°, vertical 60°, choose the second group, then its third value: 300 cd. With multiplier 1, it remains 300 cd. If the multiplier were 2, that entry would become 600 cd; this is arithmetic, not permission to change a supplier’s file.
Candela describes luminous intensity in a direction. It is not illuminance at a workstation or total luminous flux; flux requires accounting for the distribution over solid angle. CIE: luminous intensity.
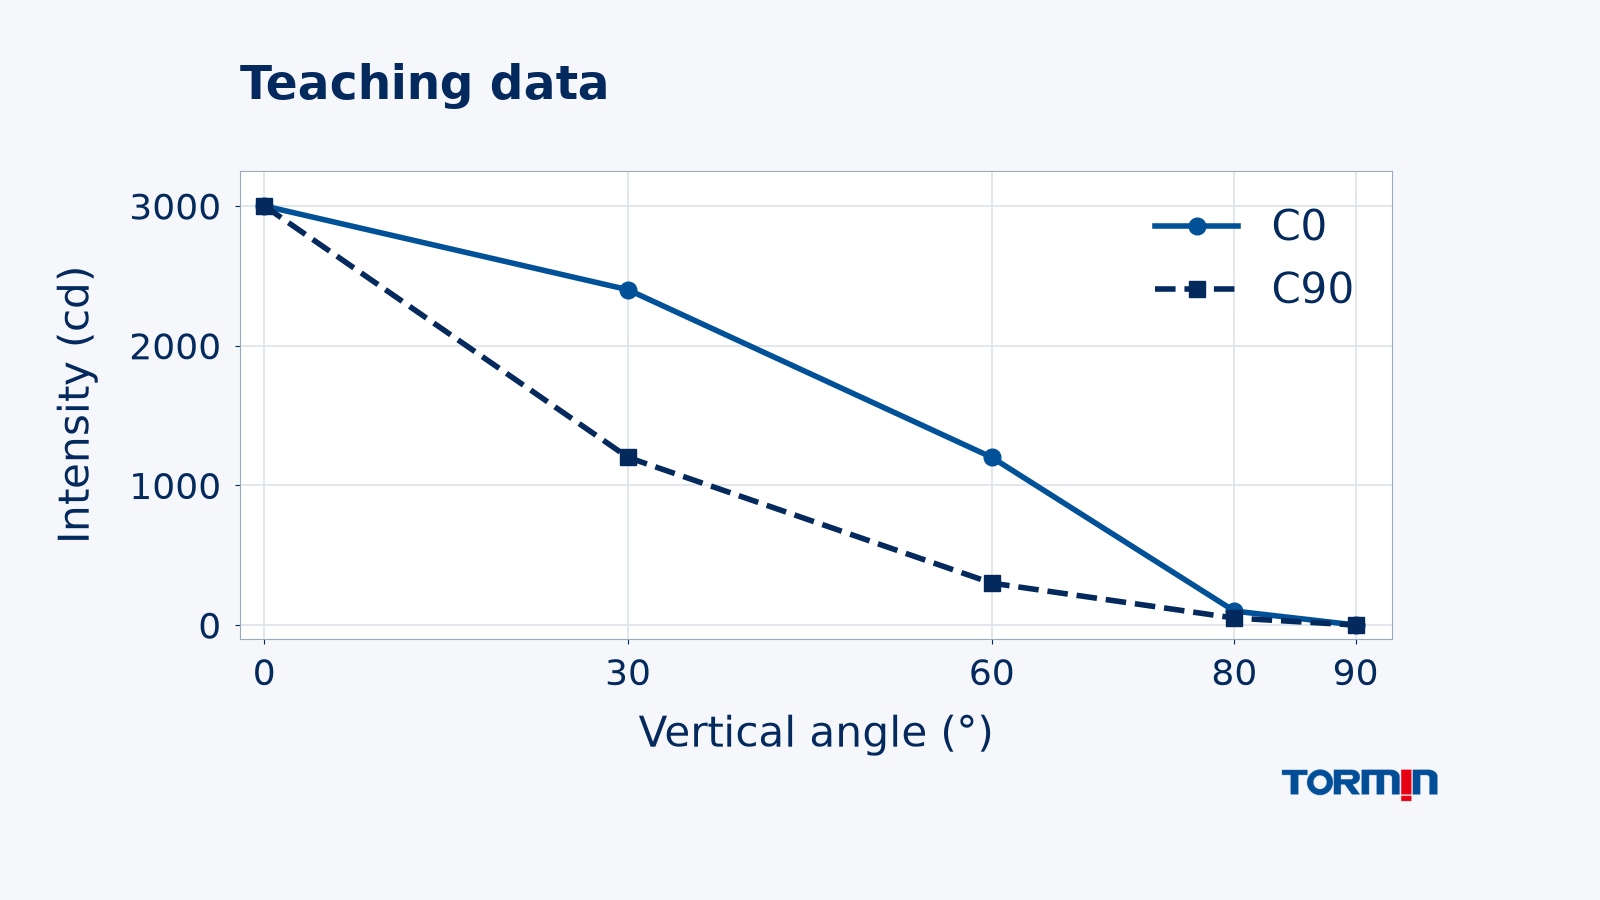
The two groups differ away from the downward axis. That is why one plane or a single peak value can hide a useful directional distinction. The chart below plots only these invented samples. Its connecting lines help reading; they do not establish measured intermediate values or a real product’s beam shape.
5. Check the viewer’s coordinates and intensity scale
For Type C data, vertical 0° is nadir, 90° is the horizon and 180° is zenith. Horizontal angles identify planes around that axis. Confirm which plane corresponds to the luminaire’s physical orientation before placing it in the model; do not transfer this convention to a Type B or Type A file. Lighting Analysts: photometric coordinate display.
On a polar plot, radius represents intensity within the selected slice. Check the selected plane and scale before comparing curves; a software plot may use an adjustable maximum. Use consistent scales for comparisons. Lighting Analysts: reading and scaling polar curves. Ask the report author to identify any normalization and its relationship to the imported data.
Our chart uses ordinary vertical-angle axes rather than a polar projection so the lookup is explicit. In a viewer, also check how any abbreviated angular range or symmetry is represented. Do not fill missing angles yourself merely to make a plot appear complete.
6. Review the import before trusting a layout result
Missing external tilt data, truncated angle or candela arrays, and inconsistent angle ordering are among the issues documented by Photometric Toolbox. Its guidance favors obtaining a correct manufacturer file when the reader is not qualified to repair the format. An automatic repair is a data change that needs review, not evidence that the test data are correct. Import errors and warnings.
Record which file revision was imported and any changes the software or operator made. Review the imported identity, coordinate orientation and scale against the matching report. If something does not align, pause the comparison and resolve it with the supplier or testing source.
AGi32 distinguishes luminous geometry and light-loss factors from other inputs. A luminous box is not the full mechanical enclosure; light-loss assumptions affect the calculated output. Software documentation: luminous box and light-loss factors.
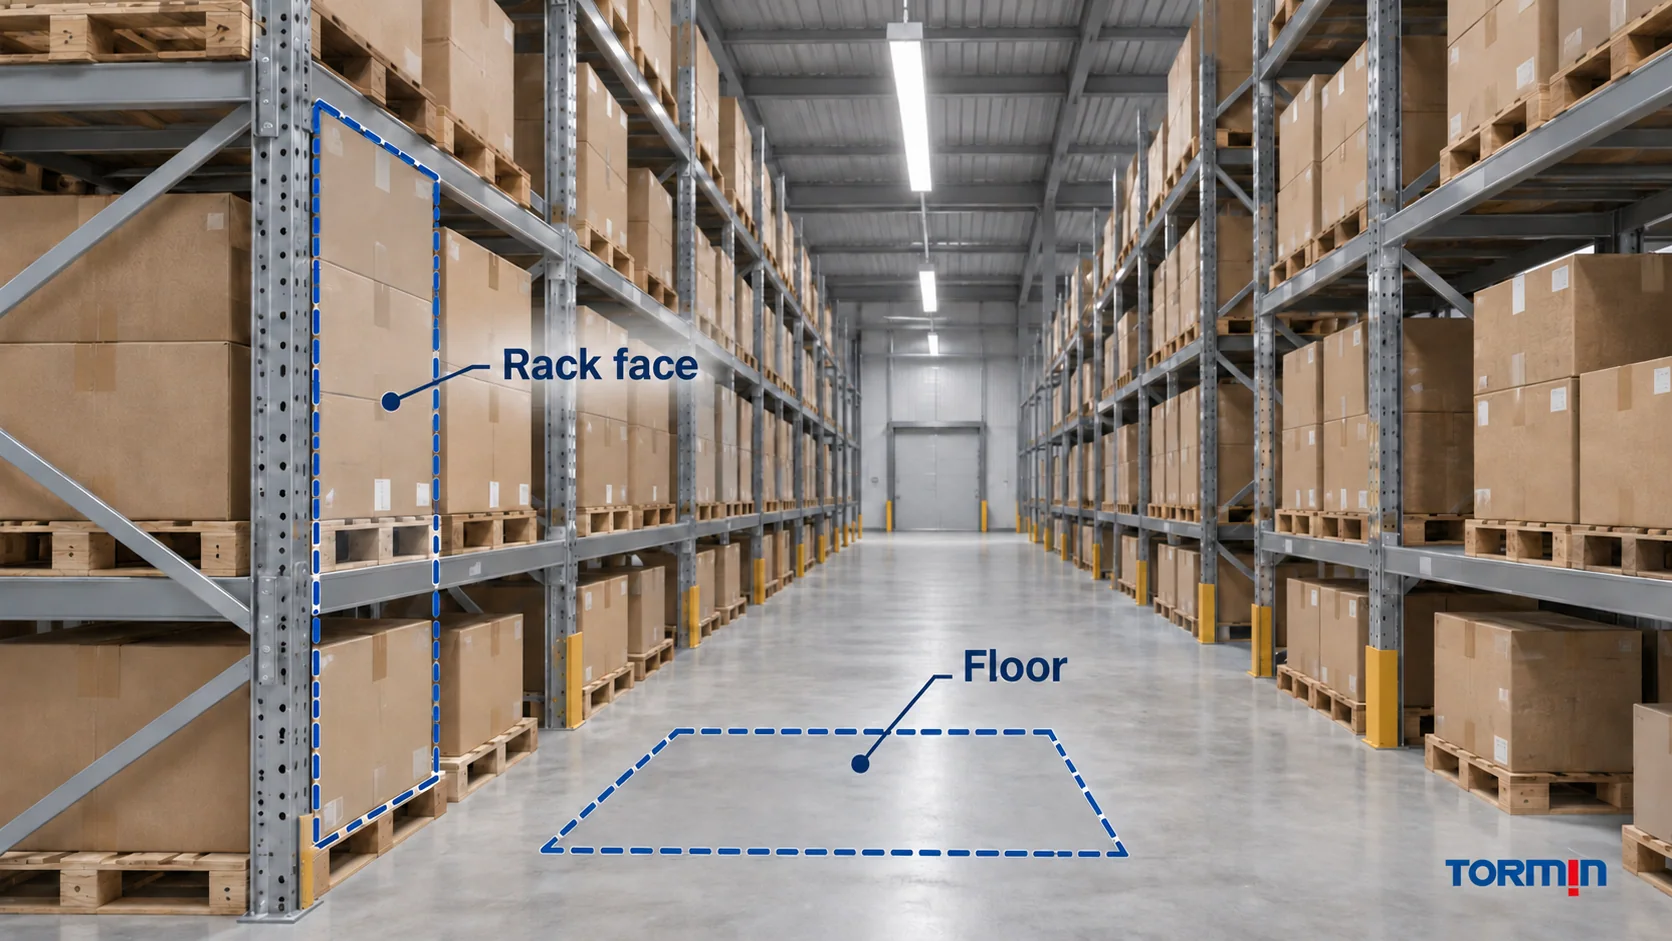
For an industrial model, identify the mounting positions, aiming, target surfaces, obstructions, reflectances, maintenance assumptions and project criteria. A warehouse floor and a rack face are different targets. TORMIN’s warehouse layout guide covers that application separately.
Keep a short file-review record
Before handing the data to the lighting designer, record four answers:
- Identity: Which exact offered configuration and report does this file represent?
- Interpretation: Which version, photometric type, units and intensity scale were read?
- Import: Which orientation and adjustments were used, and were warnings resolved?
- Remaining inputs: Which layout, target criteria or product documents are still missing?
That record makes the interpretation reviewable. It does not establish achieved illuminance, glare performance, emergency duty or hazardous-area suitability.
For a product enquiry, use the TORMIN industrial lighting category to identify candidate families, then request the file and report for the exact configuration. Include the optic, operating setting and intended application. Ask for clarification of any file/report mismatch before treating the data as an input to the project calculation.
Sources
- IES — Learn About IES Files: distribution data, plain-text reading and simulation context.
- IES — ANSI/IES LM-63-19(R25), official catalogue: current edition identification; full standard not used here.
- Lighting Analysts — IESNA LM-63 Format: legacy LM-63-2002 field and array order.
- IESNA — ANSI/IESNA LM-63-02, authorized preview: accessed contents identify the future-use field; full data clauses not accessed.
- Lighting Analysts — Photometric Errors and Warnings: codes, incomplete data and import review.
- Lighting Analysts — New Photometric File: General Information: absolute marker, multiplier, dimensions and tilt correction.
- Lighting Analysts — Luminaire Define: Photometry Section: output scaling, luminous geometry and light-loss factors.
- CIE — e-ILV 17-21-045, Luminous intensity: directional quantity and candela.
- Lighting Analysts — View 3D Photometric Representation: Type C coordinate orientation.
- Lighting Analysts — IES Indoor Report Polar Curves: selected slices and intensity-plot scales.